 Rainfall Manipulation Plot Study
Rainfall Monitoring
Natural rainfall quantities and storm intervals at the RaMPs study site are monitored with six rain gauges, Tru Chek, Edwards Manufacturing Co, Albert Lea, MN, USA) distributed across the study site. Average gauge readings are used to document each rain event and to calculate the quantity of collected rainwater to be applied in each experimental treatment. Rain gauge readings compare closely with measurements from an Ott Pluvio weighing-type rain gauge at the Konza Prairie weather station 0.5 km southeast of the study site. The chemical composition of rainwater stored in the increased rainfall interval treatments is periodically compared to fresh rainwater samples for concentrations of NO3- -N, NH4+-N, and PO43--P. Water samples are analyzed colorimetrically with an Alpkem RFA 300 autoanalyzer.
Microclimate
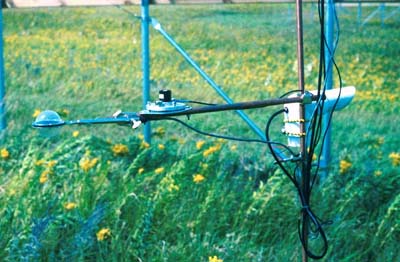
The microclimate beneath the rainout shelters is characterized in four rainfall manipulation
shelters and in an unsheltered control plot. Measurements of PPFD are made with a quantum sensor (LI-190SB, LiCor Inc., Lincoln, NE, USA), and net radiation with a Fritschen-type
net radiometer (model 605, C.W. Thornthwaite Associates, Pittsgrove, NJ, USA).
Soil, air (shielded, aspirated), and stored water temperatures are measured with thermisters
(Model 107, Campbell Scientific,
Logan, UT, USA). Radiation and air temperature sensors are mounted in the center of the plot, 1.5 m above ground level. To
characterize the warming treatments, thermisters or thermocouples are buried at
2, 5 and 15cm in warmed and ambient subplots, and canopy temperatures are monitored
with infrared thermometers. Sensor outputs are recorded on Campbell CR10X data loggers.
Soil Moisture
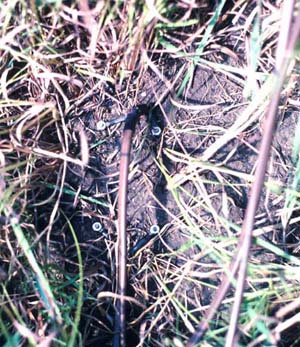
From 1998 to 2005, temporal patterns of soil water content are measured weekly using
time
domain reflectometry (Topp et al. 1980). Stainless steel probes are inserted to 15 and 30 cm depths
in each heated and unheated subplot, and moisture content determinations
are made with a Tektronix 1502B cable tester.
From 2005 to the present, an automated, high-frequency TDR measurement system utilizing a Campbell Scientific CS616 probes placed at 0-15 and 0-30cm depths in each subplot characterize hourly and daily soil moisture fluctuations which are likely important for plant root and microbial responses to wetting and drying cycles.
Neutron probe measurements of soil moisture to depths of at least 1 m in each RaMP quantify deep soil water content important for interpreting changes in root depth distributions and differences in the responses of grasses and forbs to treatments.
Soil Respiration
Soil CO2 flux is measured bi-weekly with a chamber and closed-flow gas exchange system (Li-Cor 6200 and 8100, LiCor Inc., Lincoln,
Nebraska, USA), at 4 warmed and 4 ambient temperature locations within
each RaMP. Additional measurements are made just before and after selected
rainfall events to short-term soil CO2 flux responses to individual rain events.
Grass/forb plant responses
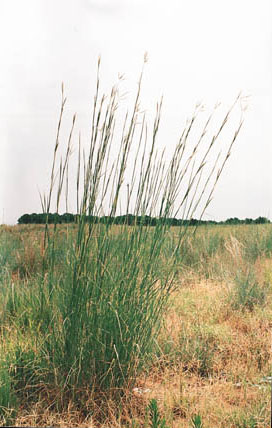
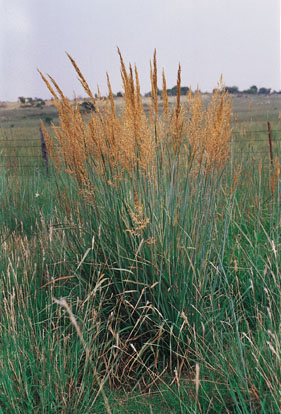
Leaf level photosynthesis and midday leaf
water potential have been conducted at varying intervals, focusing on two C4 grasses, big
bluestem
(Andropogon gerardii) and Indian grass (Sorghastrum nutans), and on the dominant forb, Canada goldenrod
(Solidago canadensis). Photosynthesis measures are made
with
an Li-6200
portable photosynthesis system and water potential is measured with a pressure chamber (PMS-1000, PMS
Instruments
Inc., Corvallis, OR).
Leaf-level chlorophyll
fluorescence is measured to determine photosynthetic capacity and stress in the
dominant C4 grass, A. gerardii, and the most common forb species, S. canadensis. Our focus has been on quantifying the decline
and recovery of photosynthetic capacity during drying and rewetting
cycles. An Opti-Sciences modulated fluorescence system (model # OSI-FL)
is used to measure achieved and potential quantum efficiency (Fv/Fm) fully
developed, upper canopy leaves (7/species/treatment) at midday (1100-1500
hrs). Additional leaves are collected for leaf water potential
determination.
Productivity and Plant Species
Composition
Aboveground NPP and species composition:
ANPP is estimated from end of season harvests of sixteen 0.1 m2 quadrats per RaMP, eight from heated areas and eight from ambient temperature areas. All biomass is sorted
into graminoid and forb components. Because the site is burned annually
and not grazed, the biomass harvested represents ANPP. Canopy cover, plant
species richness and diversity are estimated in 1-m2 permanent plots in
each RaMP (twice in a growing season to sample early and late season
species; Collins et al. 1998). Pretreatment data were collected in 1997
from all RaMP plots and was collected prior to warming the subplots.
Litter decomposition:
Litterbags (5x10 cm, 0.5 mm mesh) filled with A. gerardii roots, are
buried (10 cm deep) in the RaMPs (including the warmed subplots) to
allow for collection 4 times per year for 3-yr periods (n=12). After
collection, soil will is removed by hand and the remaining material
is lightly rinsed with deionized water, oven-dried (60C),
weighed, and analyzed for total C and N. Mass and N concentrations are corrected for soil infiltration (Blair 1988) and used to calculate
decay rates and net N fluxes (net immobilization or mineralization).
Root distribution and turnover:
Minirhizotron tubes are installed (45º angle, 1 m depth, 2 per RaMP) in an unheated subplot in each RaMP.
Images are captured with a Bartz Technology Co. (model BTC-2) digital root
imaging system to document root production. Images are
recorded at 2-4 week intervals and digitized with Rootracker software. Root image data are augmented
by end-of-season soil cores (5 cm diameter x 60 cm deep) taken at 2-yr
intervals to quantify root biomass profiles (10 cm increments) with a
minimum of plot disturbance. Soil cores (12/treatment) will be washed
and the roots collected on screens for biomass and C and N
determinations.
Plant and soil C and N:
ANPP, root and soil samples are ground, analyzed
for C and N content using a Carlo-Erba NA 1500 C/N analyzer, and archived for
possible future analysis.
N availability, extractable inorganic N, and microbial biomass
C and N:
Resin bags are used to estimate N availability under all
four temperature/precipitation regimes. This approach provides an integrated measure of N availability, and requires less
destructive sampling than buried soil cores. In addition, we will use
small soil cores (2 cm diameter) to characterize concentrations and
depth distributions of extractable N (NO3- and NH4+) on selected dates
(pre- and post rainfall application) during the growing season.
All inorganic N analyses will be done by automated analysis (Alpkem
FlowSolution System). We will also assess longer-term changes in
potentially mineralizable C and N and microbial biomass C and N (Brooks
et al. 1985).