PURPOSE:
To measure annual inputs of macroparticulates (particles greater than 1 mm2 in size) to the gallery forest floor. The data provide a conservative estimate of net primary production and will therefore measure effects of abiotic (climate) and biotic (e.g., canopy herbivores) factors on forest production. Note: Comparison of the two forks is not done and is confounded with 28 of the 30 south fork cages being in the bison area.
LOCATION OF SAMPLING STATIONS:
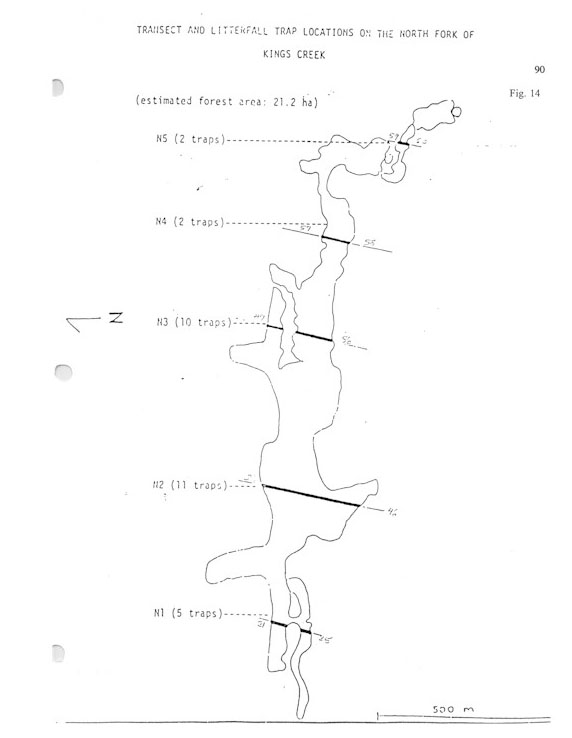
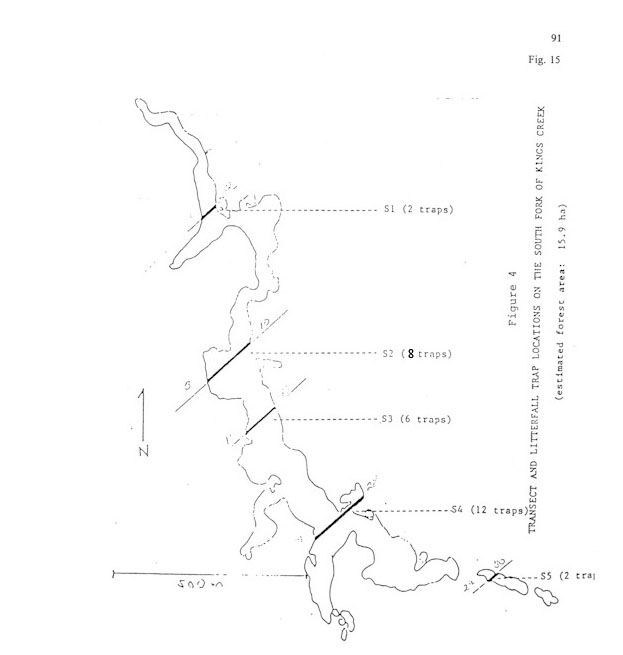
Litterfall trap placement was determined by a stratified, random design. A line was drawn on a map of the two forks of Kings Creek representing the longest possible straight line through the forest. This line was scaled to the actual length of the forest, and divided into five equal sections. A random number generator was then used to select a point on each segment, and a line perpendicular to the main line was drawn. These perpendicular lines represented the five transect lines used to place littertraps in each fork of Kings Creek (Figs. 14 and 15). The points where these lines emerged from the forest were located in the field, and a surveyor's transit and compass were used to measure the length of each transect and set stakes at 25 m along the transect lines. Once the total length of transect lines was known for each forest, the number of traps allocated to each transect line was determined. The number of traps corresponds to the relationship: length of transect/total length of transects in forest x 30. The only exception to this procedure was that each transect was assigned a minimum of two litter traps. The location of each trap was determined by a random number generator. Again, exceptions existed in site selection, and these were 1) traps were to be separated by a minimum of 5 m, and 2) traps were to be placed within 10 m of canopy foliage. This last rule was used in placing traps along transects N-1 and N-3 (Figure 14).
FREQUENCY OF SAMPLING:
Traps were placed in the field on September 4-6, 1981. Collections were made every two weeks during September, October and November and then monthly from December to August. Deviations: In 1983, collections were irregular; beginning in 1984, the autumn collections were at monthly intervals; in 1985 and 1987-1992, the monthly collections were from March through November.
VARIABLES MEASURED:
Total deposition of litter (grams of dry weight/0.25 m2) per collection period, and subdivisions of wood, seeds, and foliage (see sample data sheet, Fig. 16). Insects, insect debris, or other fecal droppings are removed prior to weighing.
METHODS:
Sixty litterfall traps, 50 x 50 cm (.25 m2) were constructed during the summer of 1981. The design of these traps was similar to those used at Coweeta (e.g., Cromack, K. Jr. 1973, Litter production and decomposition in a mixed hardwood watershed and white pine watershed at Coweeta Hydrologic Station, North Carolina. Ph.D. dissertation. University of Georgia, Athens, GA.), except that the depth of these traps was 50 cm. This "deep dish" design (Figs. 17 and 18) was used to prevent losses due to high winds. The traps open at 1 m above the forest floor. Deposition of litter into these traps due to lateral movements by wind is believed minimal (e.g., virtually no foliage was found in these traps during January, 1982, in spite of strong winds).
The allocation of 30 traps per forest floor resulted in a somewhat greater sampling intensity of the South Fork. Transect lines measured 353.6 m resulting in one collector every 11.8 m. The total transect length for the North Fork was 543.3 m resulting in one trap placed every 18.1 m.
The transects are marked by a yellow-painted steel conduit stake at each end. Furthermore, each collector is staked to a pipe and numbered from 1 to 60.
The material is dried at 60oC and weights of woody material, seeds, foliage, and total are measured.
SUMMARY OF ALL CHANGES UP TO 1993:
Collections from litterfall traps within the bison area ended January 6, 1993. The sample ID's affected are 3 through 30, inclusive. This modification is due to repeated damage to the collectors by bison.