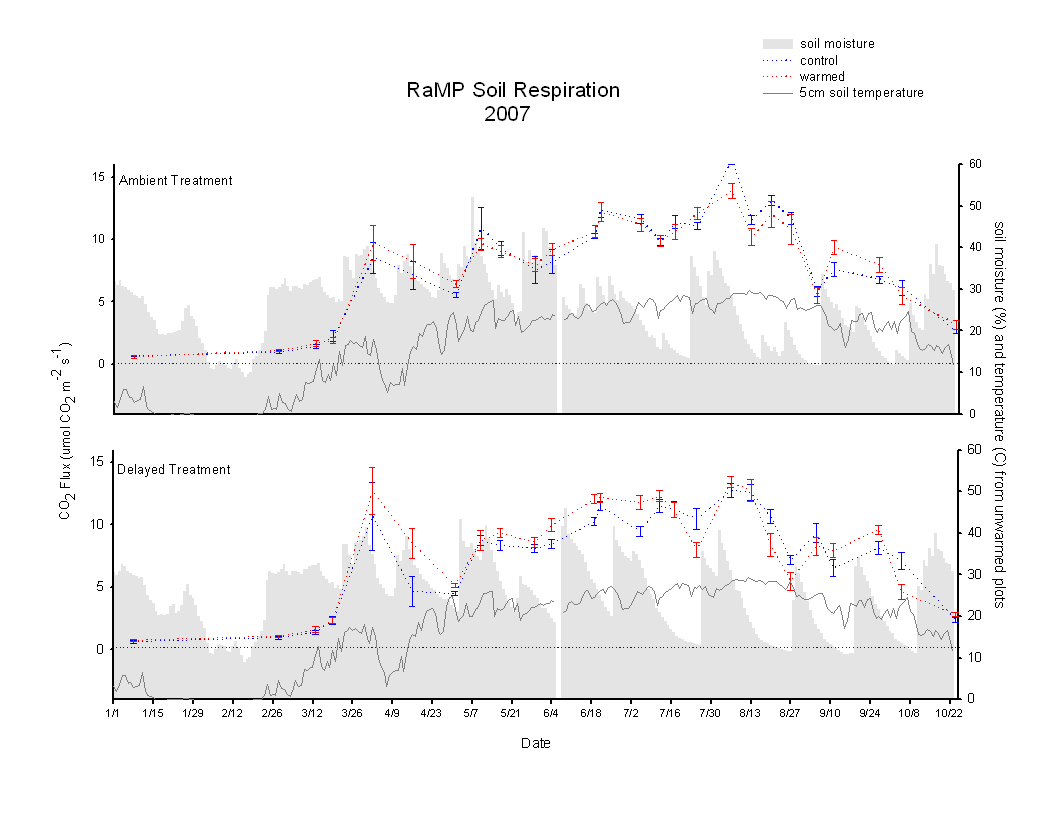
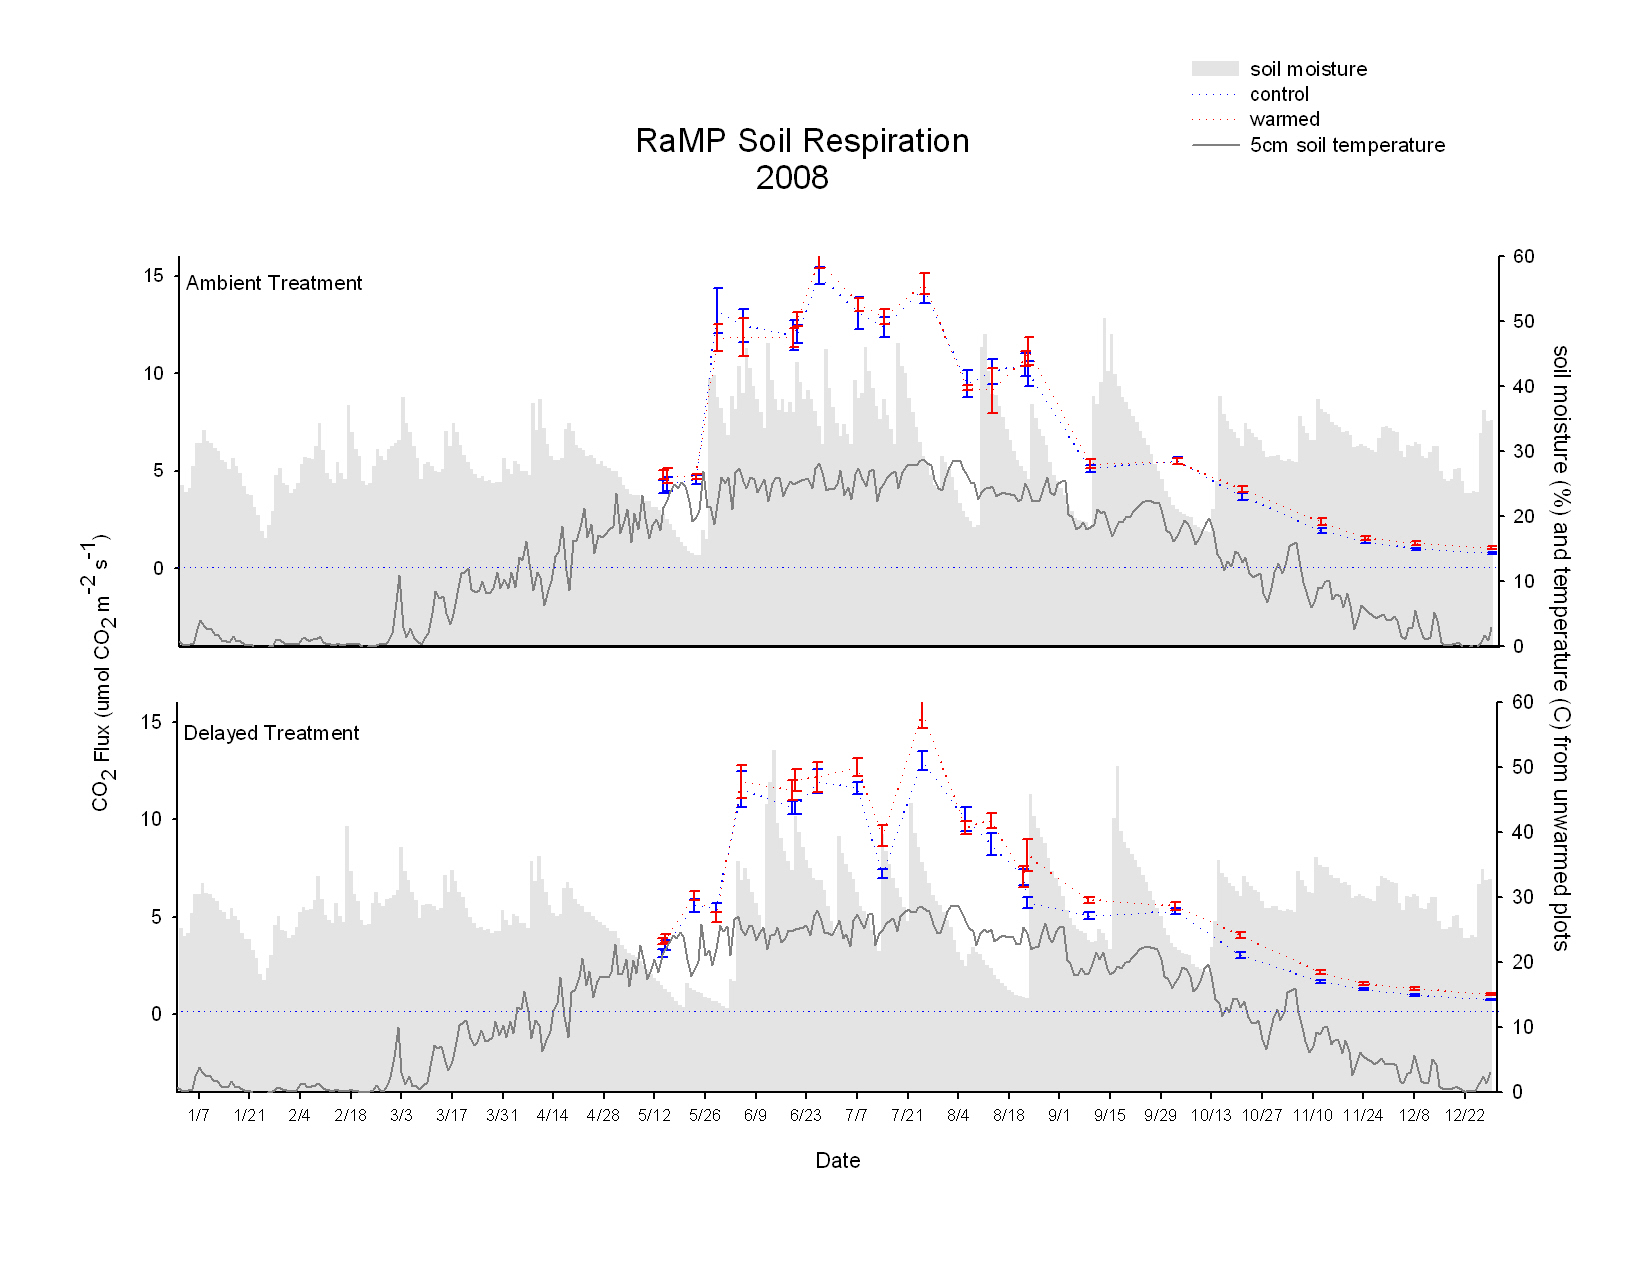
RaMPS DataCeptometer data 03 04 05 06 07 08 09 10 11 12 13 14 15 16 all1 all2 Deep Soil Moisture 02 03 04 05 06 07 08 09 10 11 12 13 14 15 16 15 cm Soil Moisture Averages 06 07 08 09 10 11 12 13 14 15 16 30 cm Soil Moisture Averages 07 08 09 10 11 12 13 14 15 16 15 cm Soil Moisture by Ramp 06 07 08 09 10 11 12 13 14 15 16 30 cm Soil Moisure by Ramp 07 08 09 10 11 12 13 14 15 16 Canopy Temperature Averages 06 07 08 09 10 14 15 16 Canopy Temp by Probe 08 09 14 15 Yearly Ramp Soil Temp 06 07 08 09 10 11 12 13 14 15 16 Soil C02 Flux 07 08 09 10 11 12 13 14 15 16 Ramps Biomass/ANPP 2003-2016 2007 Soil Core Data Graphs Irrigation Transect Soil Moisture 06 07 08 09 10 11 12 13 14 |
Current Data GraphsMicroMet This weeks graphs Canopy Temp This weeks Graphs Soil Moisture 15 cm weekly 30 cm weekly Soil Temperature This weeks Graphs
|
|
|